
Learn to Read the Market Through Price, Charts & Structure
The Technical Analysis course by OODA Pro Traders is designed for traders and aspiring market participants who want to understand how to analyze financial markets using charts, price movements, trends, patterns, indicators, and market structure.
Technical analysis is an important skill for anyone who wants to study market behavior systematically. Instead of depending only on news, opinions, or market tips, technical analysis provides a framework for examining historical and current price data to identify trends, potential support and resistance areas, momentum, and possible trading opportunities.
Our course takes you from the fundamentals of chart reading to practical technical-analysis concepts, helping you develop a structured approach to studying the market.
The objective is not to predict every market movement. Markets are uncertain, and no technical indicator or strategy can guarantee a particular outcome. Instead, the goal is to help you understand price behavior, recognize market conditions, build trading setups, and make more informed decisions with proper risk management.

Build a Strong Technical-Analysis Foundation
Successful technical analysis starts with understanding the language of the market.
Before studying advanced indicators or trading strategies, it is important to understand how charts work, what price movements represent, how trends develop, and how traders identify important levels.
The OODA Pro Traders Technical Analysis course introduces these concepts progressively so that learners can develop a solid foundation before moving into more advanced analysis.
You will learn how to read charts, identify trends, understand price patterns, recognize support and resistance, use technical indicators, and develop a systematic approach to market analysis.
What You Will Learn
1. Introduction to Technical Analysis
The course begins with the fundamentals of technical analysis and explains how traders use historical price and volume information to study market behavior.
You will learn the difference between technical and fundamental analysis and understand why technical analysis is widely used for studying short-term and medium-term price movements.
Key Learning Areas :
- What is technical analysis?
- Principles of technical analysis
- Price and volume
- Technical vs. fundamental analysis
- Market trends
- Historical price behavior
- Technical-analysis limitations
- Developing an analytical mindset
This foundation helps you understand the purpose of technical analysis before moving into charts and trading setups.
2. Understanding Price Charts
Charts are the primary tools used in technical analysis.
This section teaches you how to read different types of price charts and understand the information presented through them.
You will learn how price changes over time and how charts can help identify trends, patterns, and important market levels.
Key Learning Areas :
- Line charts
- Bar charts
- Candlestick charts
- Timeframes
- Open, high, low, and close
- Price movement
- Chart interpretation
- Multi-timeframe analysis
Understanding different timeframes can help traders view the same market from different perspectives.
For example, a larger timeframe may provide information about the broader trend, while a smaller timeframe may help analyze short-term price movement.
3. Candlestick Analysis
Candlesticks provide valuable information about price behavior within a specific period.
The course introduces learners to candlestick structure and commonly studied candlestick formations.
You will learn how to interpret the relationship between opening and closing prices and the highs and lows reached during a trading period.
Key Learning Areas :
- Candlestick structure
- Bullish and bearish candles
- Candle bodies
- Upper and lower wicks
- Market sentiment
- Reversal patterns
- Continuation patterns
- Candlestick confirmation
Candlesticks should be studied in context rather than treated as independent signals. A candle formation can have different meanings depending on market trend, location, volume, and surrounding price action.
4. Market Trends
Understanding market direction is one of the most important elements of technical analysis.
This section helps learners identify whether the market is moving upward, downward, or sideways.
Key Learning Areas :
- Uptrends
- Downtrends
- Sideways markets
- Higher highs
- Higher lows
- Lower highs
- Lower lows
- Trend identification
- Trend continuation
- Potential trend changes
Understanding market structure can help traders avoid taking positions without considering the broader market environment.
5. Support & Resistance
Support and resistance are fundamental concepts in technical analysis.
Support represents an area where buying interest may become stronger, while resistance represents an area where selling pressure may increase. These levels are not guarantees of reversals but can provide useful reference points when studying price behavior.
Key Learning Areas :
- Identifying support
- Identifying resistance
- Horizontal levels
- Dynamic support and resistance
- Breakouts
- Breakdowns
- Retests
- Role reversal
- Key price zones
Learning to identify important market levels can help traders develop better entry, stop-loss, and target-planning frameworks.
6. Chart Patterns
Chart patterns are formations that traders study to understand potential continuation or reversal scenarios.
The course introduces learners to commonly observed chart patterns and explains how they can be analyzed within the context of the broader market.
Key Learning Areas :
- Continuation patterns
- Reversal patterns
- Breakout patterns
- Triangle formations
- Channels
- Double tops
- Double bottoms
- Head and shoulders
- Pattern confirmation
- Target and risk considerations
The focus is on understanding the structure behind a pattern rather than blindly trading every formation.
7. Technical Indicators
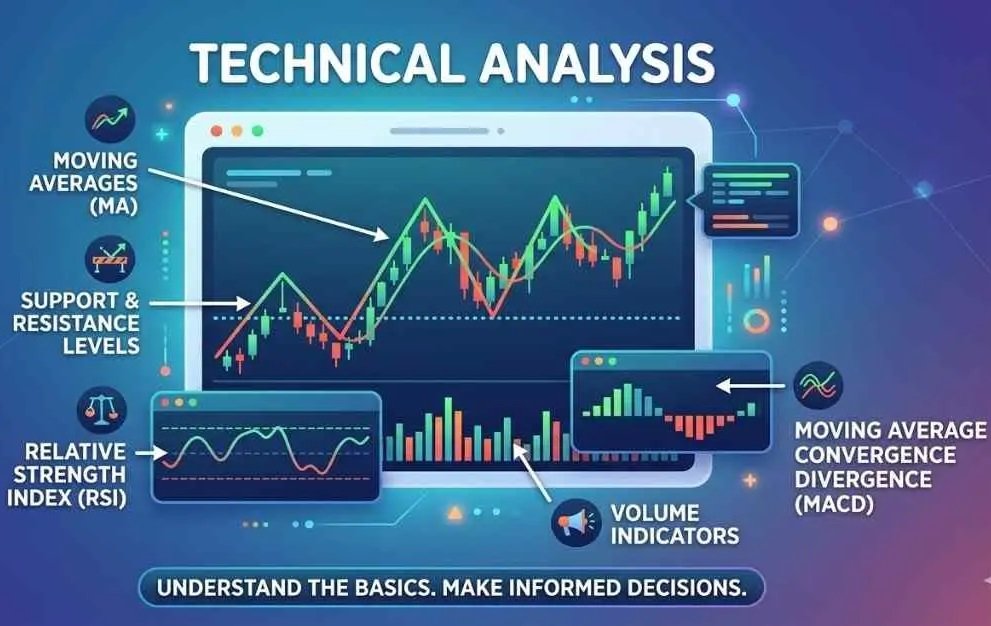
Technical indicators can help traders analyze momentum, trend strength, volatility, and market conditions.
The Technical Analysis course introduces the purpose and application of commonly used indicators and explains how they can support market analysis.
Key Learning Areas :
- Moving averages
- Momentum indicators
- Oscillators
- Trend indicators
- Volume-based indicators
- Overbought and oversold concepts
- Indicator confirmation
- Combining indicators
Indicators are tools—not guaranteed prediction systems. Using too many indicators can also create confusion. A structured approach focuses on understanding why an indicator is being used and how it fits within the overall trading methodology.
8. Price Action
Price action focuses on studying the movement of price itself.
Instead of relying entirely on indicators, traders can examine market structure, candlesticks, support and resistance, breakouts, rejections, and other price behaviors.
The course helps learners develop an understanding of how price may react around important market areas.
Key Learning Areas :
- Price movement
- Market reactions
- Breakouts
- Rejections
- Momentum
- Market structure
- Price zones
- Confirmation
- Multi-timeframe price analysis
Price-action analysis can complement technical indicators and other analytical methods.
9. Dow Theory
Dow Theory is one of the foundational concepts associated with technical analysis.
The course introduces learners to the principles behind Dow Theory and its approach to understanding market trends.
You will explore how markets can be studied through trends and price movements and how different market phases may provide information about overall market direction.
Key Learning Areas :
- Principles of Dow Theory
- Primary trends
- Secondary trends
- Minor trends
- Market confirmation
- Trend analysis
- Market phases
Understanding foundational theories can help learners develop a stronger conceptual understanding of technical analysis.
10. Elliott Wave Theory
The course also introduces Elliott Wave Theory, a framework used by some market participants to study recurring patterns in market psychology and price movement.
Learners can explore the basic principles of wave structures and how traders attempt to interpret market cycles.
Key Learning Areas :
- Elliott Wave principles
- Impulse waves
- Corrective waves
- Market cycles
- Wave structure
- Trend analysis
- Practical chart observation
As with all analytical frameworks, Elliott Wave analysis involves interpretation and uncertainty. It should be used as part of a broader analytical process rather than as a guaranteed forecasting method.
Develop a Technical Trading Strategy
Learning individual concepts is only the beginning. The next step is understanding how those concepts can be combined into a trading framework.
Through the Advanced Smart Investor program, learners can work toward developing a framework that includes:
Market Analysis → Setup Identification → Confirmation → Entry Planning → Risk Management → Trade Management → Review
This process can help traders avoid making decisions based solely on emotions or isolated indicators.
Before considering a trade, you can ask:
- What is the current market trend?
- Where are the important price levels?
- What setup is forming?
- What confirms the setup?
- Where would the trade idea become invalid?
- What is the potential risk?
- What is the expected reward?
- How will the trade be managed?
Risk Management
Technical analysis can help identify potential trading opportunities, but it cannot remove market risk.
Every trading strategy can experience losing trades. Therefore, risk management should be an essential part of any technical-analysis system.
The course emphasizes the importance of understanding concepts such as:
- Stop-loss planning
- Position sizing
- Risk-to-reward
- Capital protection
- Trade management
- Avoiding overtrading
- Maintaining discipline
- Reviewing trading performance
A good technical setup without proper risk management can still result in significant losses.
Practical Technical-Analysis Learning
Technical analysis becomes more useful when learners practice applying concepts to actual charts.
OODA Pro Traders encourages learners to study historical and current market charts to understand how technical concepts behave in different conditions.
Practical learning can involve:
- Chart reading
- Trend identification
- Support and resistance analysis
- Pattern recognition
- Indicator analysis
- Price-action study
- Multi-timeframe analysis
- Historical chart review
- Strategy backtesting
- Trade journaling
Practice helps learners understand that markets do not always behave exactly as textbook examples suggest.
Who Is This Course For?
The Technical Analysis course can be suitable for:
- Beginners learning chart analysis
- Aspiring traders
- Stock-market learners
- Intraday traders
- Swing traders
- Investors wanting technical knowledge
- Traders looking to strengthen their chart-reading skills
- Learners interested in price action
- Individuals interested in technical indicators and market structure
Whether you are starting from scratch or already have basic market knowledge, the course can help you build and strengthen your technical-analysis foundation.
Start Learning Technical Analysis Today
Build your foundation, sharpen your chart-reading skills, and develop a structured approach to analyzing financial markets with OODA Pro Traders.
Learn the fundamentals. Understand technical and fundamental analysis. Explore derivatives, commodities, and currencies. Study market structure and Smart Money Concepts. Practice your analysis and develop a disciplined approach to risk.
Build Your Knowledge. Understand the Market. Build Your Strategy. Develop Your Trading System.